The Cellar: a friendly neighborhood coffee shop, with no coffee and no shop. Established 1990.
- glatt
- TM
 Offline
 - From: Arlington VA
- Registered: 10/13/2020
- Posts: 1,224
Re: Charts, Graphs, & data piles.
is of some interest today.
- Diaphone Jim
- Not Ignoring You.
 Offline
 - Registered: 10/13/2020
- Posts: 1,419
Re: Charts, Graphs, & data piles.
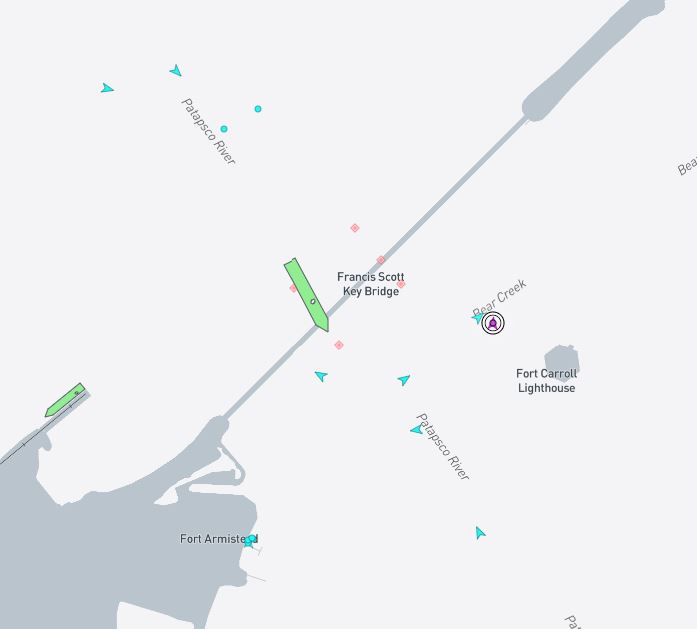
The main world map that comes up on the Marine Traffic link is astounding.
- Flint
- starting fires since forever
 Offline
 - From: i am dumb
- Registered: 10/13/2020
- Posts: 1,539
Re: Charts, Graphs, & data piles.
Diaphone Jim wrote:
The main world map that comes up on the Marine Traffic link is astounding.
This reminds me of how the Microsoft flight simulator uses weather satellite data to make the weather in the simulation match the weather from reality, in real-time.
signature s c h m i g n a t u r e
- griff
- A Magical Woodland Creature
 Offline
 - Registered: 10/13/2020
- Posts: 3,138
Re: Charts, Graphs, & data piles.
Watching that bridge collapse was surreal. It will be interesting to see in what ways it performed as expected and what was a failure of design and construction.
If you would only recognize that life is hard, things would be so much easier for you. - Louis Brandeis
- glatt
- TM
 Offline
 - From: Arlington VA
- Registered: 10/13/2020
- Posts: 1,224
Re: Charts, Graphs, & data piles.
According to Marine Traffic website, the ship has a draught of 12.2 meters (or 40 feet). According to Google Earth, the depth of that river is around 50 feet in the middle of the channel and about 10-20 feet at the edges of the channel near where the supports are. Marine traffic reports the status of the ship as "aground."
- tw
- Member
 Offline
 - Registered: 10/16/2020
- Posts: 1,732
Re: Charts, Graphs, & data piles.
griff wrote:
It will be interesting to see in what ways it performed as expected and what was a failure of design and construction.
Obviously the sections on either side of the support pylon would fail. Curious is why a section to the right, with supports on both ends, failed. That right side section should have remained standing.
Cruise ships complained that their newest ships could not pass under this bridge. Problem corrected.
- xoxoxoBruce
- The Future is Unwritten
 Offline
 - Registered: 10/15/2020
- Posts: 4,355
Re: Charts, Graphs, & data piles.
When the main section fell it probably yanked the section on the right off it's support at the shore end.
Freedom is just another word for nothin' left to lose.
- •
- xoxoxoBruce
- The Future is Unwritten
 Offline
 - Registered: 10/15/2020
- Posts: 4,355
Re: Charts, Graphs, & data piles.
Freedom is just another word for nothin' left to lose.
- •
- glatt
- TM
 Offline
 - From: Arlington VA
- Registered: 10/13/2020
- Posts: 1,224
Re: Charts, Graphs, & data piles.
It's very good for the US that there is that much money in circulation. Many foreign countries use the USD, and as long as they do, our empire will be strong. It's the world currency. Virtually everyone holds assets in USD.
- tw
- Member
 Offline
 - Registered: 10/16/2020
- Posts: 1,732
Re: Charts, Graphs, & data piles.
Problems have been created by tax cuts to the rich and other changes. Gini index has increased. Only 1% of Americans now own more than 50% of the wealth.
What has a latest 'welfare to the rich' done? Hedge fund were created to buy up homes. That increased home prices. Then hedge fund had to price rents so that the funds could provide profits. This combined with a housing shortage. Both home prices and rents increased faster than incomes for the lower 99%.
All made living even more expensive. And contributed significantly to inflation. Who suffers most with increased inflation? The lower classes. Inflation can even make the rich richer.
We have a serious problem found especially among extremist mindsets. Trump can state he pays no or almost no taxes. Right wing extremists cheer him as if it was good. The richest now pay a lower tax rate than everyone else. Even explains increasing Federal debts.
Then extremists refuse to let the IRS hire investigators. IRS now has so few investigators that almost no one, in the top 1%, is investigated. More welfare for the rich. Extremists know this is good.
GE pays no or almost no taxes every year. Extremists tell their disciples that the corporate tax rate was 34%. Forget to mention so many tax breaks that large corporations also pay almost no taxes. And so again, the lower classes get screwed.
Never forget "Mission Accomplished". That bogus lie (war) is about 10% of this nation's debt. Who is paid interest on that debt? Countries that paid for that war - ie China. More reasons why the average man will see his net wealth decrease. Afghanistan (another war that America lost) added more points to the debt. Since Cheney said, "Reagan proved that deficits don't matter." It only does many years later when the little people get stuck with a result.
Leona Helmsley clearly defined this problem. "Only the little people pay taxes." Since then, it has become worse. Trump can brag about paying no taxes. Then extremists cheer.
Trump also knows where the most easily scammed American exist. He just did another public stock offering of his shell company for $8billion. For a social media company that will not be profitable. But then he knows where the dumbest people are. They don't know anything posted above. And then claim all that must be good. Trump said so. It must be true.
That increased Trump's estimated wealth from $2billion to maybe $8billion. He knows why the least informed people avidly endorse their own lowered standards of living. In an economy that is booming. Because the Gini index is increasing - thanks to brainwashed citizens. Ordered what to believe just like they also knew Saddam had WMDs.
Trump did same with four Atlantic City casinos that never made a profit. He also dumped them on the little people. Their pension funds and other financial structures bought those casino. Instant profits for Trump by duping the little people. Many do not even know they enriched Trump.
Even in Russia, China, and Europe, the Gini index is not excessively high - as in America.
Over 100 years ago:
Virtually everyone holds assets in pounds
Then what happened?
Last edited by tw (3/28/2024 9:27 am)
- xoxoxoBruce
- The Future is Unwritten
 Offline
 - Registered: 10/15/2020
- Posts: 4,355
Re: Charts, Graphs, & data piles.
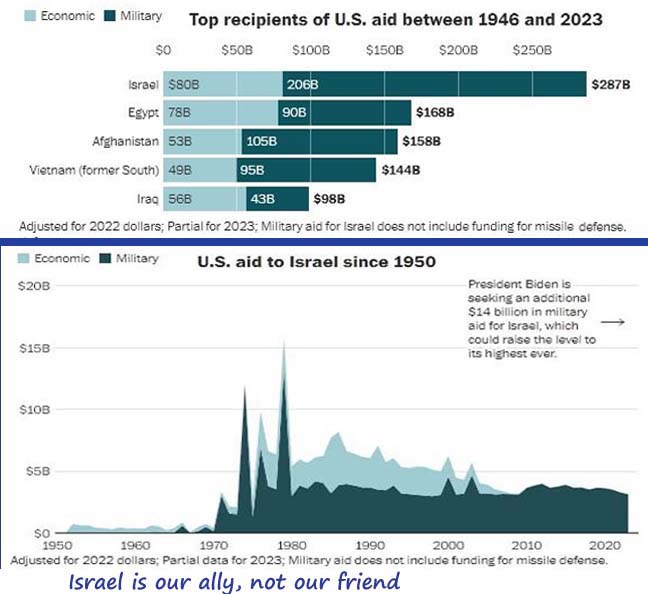
7 good Samaritans delivering relief supplies I paid for, were murdered with weapons I paid for, and I'm pissed.
=13px
Freedom is just another word for nothin' left to lose.
- •
- tw
- Member
 Offline
 - Registered: 10/16/2020
- Posts: 1,732
Re: Charts, Graphs, & data piles.
Earlier that week, an Israeli Colonel was avidly and aggressively denying that people in Gaza were starving. He insisted they were all well fed. Said so angrily. Central Kitchen was feeding 170,000 people a day. How does that feed 1.5 million people.
This murder occurred in an area save and under Israeli control. Three separate vehicles all spaces almost a mile apart. Well marked. But they were feeding Palestinians. Israeli right wing extremist attitudes are always quite apparent.
Extremists then said they saw, from the drone, a Hamas fighter get into one of the vehicles. That justified all attacks? Of course, If one is an extremist.
International law says an invading army must take care of civilian refugees. Instead, right wing Lukid extremists herded them all into the same battlefield that contained Hamas. No accident. Then massacring Palestinians civilians is legal - according to a vague definition in international law.
Israelis could have herded civilians into safe areas. Inspecting all for no weapons. But that means Israelis are not doing ethnic cleansing. Likud says the Palestinians should go back where they came from. Exact same concept promoted in the deep American south to justify hate and violence against blacks.
Israel today says all food delivery occur without restrictions. Not even one aid agency agrees. Even the UN says that is a lie. But then lying is routine with Likud - the Nazi party of Israel. Likud clearly intends to steal the entire West Bank, And openly says a two state solution will never exist. Likud is the party of hate. And so corrupt as to even subvert and disband the Israeli Supreme Court.
Is Likud doing anything to rescue hostages? Of course not. They never tried. As long as hostages are held and murdered (even by Israeli planes), then Likud will be more popular.
Three Israelis escaped from their Palestinian prison. Hid out for three days. Had Yiddish words for help painted on the building. Finally found Israeli troops. Even approached with a while flag. And were murdered by those Israeli troops. None are being prosecuted.
All directly traceable to who Likud is. 85% of all problems are directly traceable to top management. Who clearly expresses contempt for every Palestinian.
Right wing extremists are always the enemy of patriots - the moderates. Sre even the enemy of their own hostages. And, of course, the enemy of all innocent civilians.
Seven aid workers. No problem. They must have been doing something wrong. When that does not work, then put up a show of dismissing a couple of officers. Just like in My Lai (Nam), corrupt officers will later be pardoned.
- xoxoxoBruce
- The Future is Unwritten
 Offline
 - Registered: 10/15/2020
- Posts: 4,355
Re: Charts, Graphs, & data piles.
Freedom is just another word for nothin' left to lose.
- •
- glatt
- TM
 Offline
 - From: Arlington VA
- Registered: 10/13/2020
- Posts: 1,224
Re: Charts, Graphs, & data piles.
This chart seem a bit inflated. I guess "comfort" is a relative thing.
The U.S. median household income is around $75K. I think if you spoke to most Americans and asked them if they would be comfortable with a 50% increase in income, they would agree. And yet that would only put them about halfway to the numbers here.
- tw
- Member
 Offline
 - Registered: 10/16/2020
- Posts: 1,732
Re: Charts, Graphs, & data piles.
Quite accurate. The term 'comfortable' is subjective. Therefore is best called deceptive or a lie.
One factor that defines comfort, without being subjective, is a rent or mortgage that is only 20% of one's income.
Now that the 1% own more than 50% of the economy (due to lies from extremists such as tax cuts), then the rich must be uncomfortable without a one month European or tropical vacation. Now what does the chart say?
- xoxoxoBruce
- The Future is Unwritten
 Offline
 - Registered: 10/15/2020
- Posts: 4,355
Re: Charts, Graphs, & data piles.
Freedom is just another word for nothin' left to lose.
- •
- glatt
- TM
 Offline
 - From: Arlington VA
- Registered: 10/13/2020
- Posts: 1,224
Re: Charts, Graphs, & data piles.
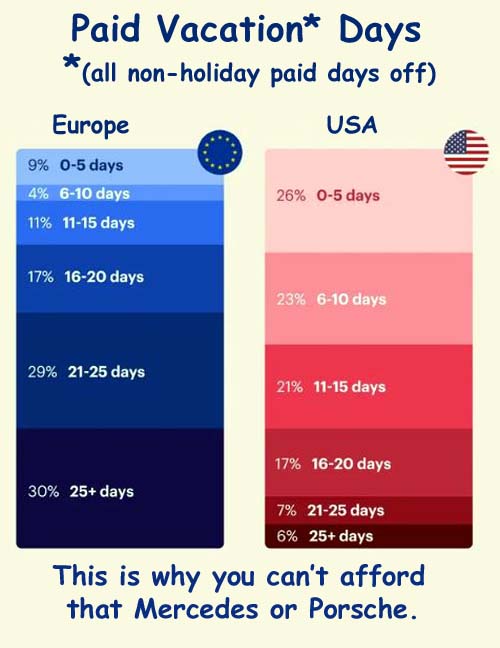
I've been in my job for 33+ years, and I am senior enough that I accrue 6 weeks of annual leave a year.
They just changed the leave policy so that I can no longer cash out my unused annual leave balance exceeding 4 weeks as of my hiring date each year. Instead, I just stop accruing when I hit a balance of 6 weeks. So I'm shifting from a "save my leave" mindset to a "burn my leave" mindset. I'm turning into one of those people who just take days off here and there. 6 weeks is a lot of time to take off. That's 3 big two-week vacations each year. They still expect me to get my work done, so it's almost a problem. But all the employees are in the same boat, so we are doing our best to cover for each other so we can take vacations.
- Clodfobble
- Hella Proactive
 Offline
 - From: Austin, TX
- Registered: 10/13/2020
- Posts: 903
Re: Charts, Graphs, & data piles.
Does that mean they'll still let you cash out 4 weeks' worth, or you can cash out none of it, ever?
- griff
- A Magical Woodland Creature
 Offline
 - Registered: 10/13/2020
- Posts: 3,138
Re: Charts, Graphs, & data piles.
I guess you’re pushing your retirement out 6 weeks?
If you would only recognize that life is hard, things would be so much easier for you. - Louis Brandeis
- Flint
- starting fires since forever
 Offline
 - From: i am dumb
- Registered: 10/13/2020
- Posts: 1,539
Re: Charts, Graphs, & data piles.
glatt, I've been working "4 tens" --it's an incredible work/life balance as I have 75% as much time off as my working days
If you worked "4 eights" for half the year, that would be 26 of your 30 vacation days
..maybe have a scheduled Friday off, every other week?
signature s c h m i g n a t u r e
- glatt
- TM
 Offline
 - From: Arlington VA
- Registered: 10/13/2020
- Posts: 1,224
Re: Charts, Graphs, & data piles.
No more cash outs at all.
And we are supposed to ensure coverage for ourselves if we are going to be out, but other than that, we can give a moment's notice. Each of us has a list of deadlines we are responsible for, going off into infinity, and before vacations, I just work to get ahead of the deadlines. Any I can't cross off the list, I get somebody else to cover for me.
Some things are non-negotiable though. Like if you are on a case, and it's scheduled for trial on a certain date, you won't be taking vacation then. But I don't work on litigations, so I don't need to worry about that.
I've never had a leave request denied. I'm not sure what I would do if it happened. I don't expect it to.
As far as bad weather goes, I can just work from home on those days. I'll never have a snow day again.
- glatt
- TM
 Offline
 - From: Arlington VA
- Registered: 10/13/2020
- Posts: 1,224
Re: Charts, Graphs, & data piles.
They save so much money by implementing the new policy.
I just used PTO to attend an appointment yesterday. I had worked a handful of extra hours earlier in the week, and when I work over 40 hours in a week, I get paid 1.5X for those extra hours. By using PTO yesterday afternoon instead of clocking back in and working late to make up the missed time, I am going to come nowhere near 40 hours of worked time, and I won't break in to the 1.5X rate this week. This new policy pays dividends to the firm, both coming and going.
I understand it's just a way for the firm to increase profits at the expense of workers, and I know that if I don't like it, I can look elsewhere for employment, but I'm not really motivated to do that. I'm hoping/planning to retire in the next 2 years and it's not worth the hassle to switch jobs. So instead I'm just going to make sure I never leave any compensation on the table by always using my PTO before I reach the maximum and I stop accruing.


